LPV
The Longitudinal Profile Variance is a measure of the ride quality of individual lengths of the road that can be used to assist in the assessment of the likely user opinion of that length of road. The longitudinal profile data is mainly provided by a scanner survey vehicle. This tells us about the profile of the road and users perception of ride quality. To evaluate the effect of surface unevenness on the vibration experienced in vehicles it is necessary to examine the unevenness associated with the range of wavelengths in the road profile that can interact with the suspension of the vehicle.

Types of Longitudinal Profile Variance
Moving Average Longitudinal Profile Variance On the local authority road network, ride quality is assessed using moving average longitudinal profile variance. Moving average longitudinal profile variance is calculated for every the value of the moving average filtered profile (over a defined length L) from the longitudinal profile at each longitudinal profile point, and obtaining the square of this number, hence:
Variance = (Pj-PjA)2wherePjis the profile amplitude at pointj, andPjAis the moving average at pointj.Moving average longitudinal profile variance measurements are typically averaged over lengths of 10m to generate the average moving average longitudinal profile variance
Enhanced Longitudinal Profile Variance Moving average longitudinal profile variance can be affected by features not directly related to pavement profile, such as road geometry (i.e. crossfall, curvature, gradient). These features can cause falsely high values to be reported in the moving average longitudinal profile variance, particularly in 30m moving average longitudinal profile variance and to a lesser extent in 10m moving average longitudinal profile variance. Thus, research was needed into finding a better method of assessing the profile, which reduced the influence of these other features. The result of this research was the introduction of a modified variance measurement called “enhanced variance”. For this measure, the moving average is replaced by a filter of the profile data that reduces the contribution of features, such as road geometry, to the variance measurement. As for moving average variance, enhanced variance is assessed over three wavelength ranges having upper limits of 3m, 10m and 30m.
Method of data collection
The main method for data collection of LPV data in Ireland is the road surface spoiler machine (RSP). This is a Dynatest model 5051 Mark III RSP test system.
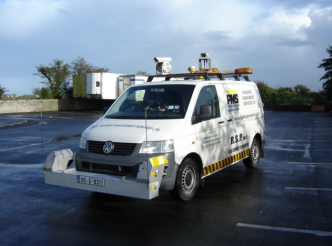
Figure 1 - The RSP Multi-function Survey Vehicle
Figure 1 shows the RSP machine used in the study. The laser sensors, accelerometers and inertial motion sensor are mounted in a Transducer Unit or “Rut Bar” at the front of the vehicle. The basic rut bar is 1.83m in length. Using a number of additional angled wing lasers on both ends of the basic rut bar, the total effective measurement width is increased to 3.2m.
As the survey vehicle traverses the pavement the measurements from the sensors are continuously recorded in order to generate a line containing the longitudinal profile of the pavement in the nearside wheel path. However, the measurement of the true longitudinal profile cannot simply be obtained by measuring the height of the survey vehicle above the pavement, as this height will depend not only on the road profile but also on the movement of the vehicle suspension as it drives along. Hence the measured longitudinal profile will be affected by the movement of the vehicle and we will be unable to derive a measure of the true longitudinal profile without removing this from the measured data.